Many good teachers end up leaving the profession for a variety of reasons, often after only a few years in the classroom. Part of it, surely, is how teachers are treated in the US, as shown in Punch Teacher, a particularly sharp satirical bit in one of the Muppet movies. Some of those who leave the classroom still want to help math education, without being teachers themselves.
I had the good fortune of decent working conditions, which allowed me to teach for 43 years at almost all K-12 levels. In 2013, I retired and joined the ranks of the consultants and curriculum developers who try to help from the outside. I’ve been able to do this reasonably well, because all these years of teaching experience allowed me to grow both mathematically and pedagogically, meaning that I do have some hard-earned wisdom (and curriculum materials) to share — as you will see in this post.
An Easy Calculation Can Mask an Important Concept
I recently read Dan Meyer’s insightful piece “Why Teaching is Harder When the Math is Easier”. He points out that calculating slope is a straightforward proposition, but that this very fact makes it difficult to get across all the concepts that are embedded in that simple calculation. Typically, we teach “rise over run” to students, and keep reminding them about this. (One French educator told me “rise over run is a religion for American math teachers.”)
Because the underlying concept is so important, I had to face this particular challenge head-on in my decades of teaching high school students about slope. You can find some of the resulting curriculum materials on this page of my website: Rate of Change. In today’s post, I’ll try to share the pedagogy behind those activities. Note that “slope” is about the representation of rate of change on a graph. Rate of change is the underlying concept across representations, which explains the title of this blog post and of the corresponding page on my website.
Before getting into the specifics, I’d like to make a big-picture observation: If a concept is important, the goal should be to find multiple ways to teach it. Searching for “the best” way to teach it is a fool’s errand. Yes, some approaches are better than others, but nothing works as well as teaching the concept in more than one way. I discussed this before on this blog:
- In 2015, in How To, I critiqued the idea that there is one best way to teach any given topic, using equation solving as an example.
- In 2016, I challenged those who believe they have found the way to teach math in Eclectic and the subsequent posts.
- In 2020, I wrote No One Way, which I used to explain my website’s motto (“There is no one way.”) Using examples spanning all grade levels, I argued that it is the math itself that demands that we approach important topics in multiple ways.
Much of the above ended up in my recent book about math pedagogy, (co-authored with Robin Pemantle). This is in fact reflected in the book’s title: There Is No One Way to Teach Math: Actionable Ideas for Grades 6-12. Read about it here, see the Table of Contents here, and order it here. Until 31 March 2026, you can get 20% off.
On to the specific pedagogical insights embedded in my various rate of change activities.
No Three on a Line
How many points can you put on an n by n lattice so that no three points are on a line? There is a conjecture that you can place 2n points under this constraint, but as n gets bigger, it’s not so easy to do. Here is a successful example where n = 2:

Having students check each other’s attempts forces a discussion of slope — possibly long before the concept has been discussed or even named. This grounds the algebraic concept in a concrete challenge. This activity can be done in middle school, or even late elementary school. Or frankly at any time: the challenge is equally engaging for students at any level and even to their teachers.
Pedagogical insights:
- A hands-on puzzle with no technical jargon can trigger curiosity, engagement, and a foundation for discussion.
- Discrete explorations on a lattice provide a foundation for later work in the Cartesian plane.
Link: No Three on a Line
Similar Rectangles
Two rectangles are similar if their sides are in a proportional relationship. This situation is simpler than what we have for triangles, or for figures in general, because similarity requires equal angles. That, of course, is a given in rectangles since all the angles are right angles. A visual way to assess whether sides are proportional is to superpose the rectangles, in a way that they share a vertex, and the short and long sides extend in the same direction. In this setup, if they share a diagonal, then the rectangles are indeed similar. This is the basis of a lesson in Geometry Labs (section 10.2, possibly preceded by 10.1), which opens with this figure:

This diagonal test rests on understanding slope: if the rectangles share a diagonal, it means that the “rise over run” for each are equivalent fractions.
That same lesson ends with hands-on geoboard challenges: find families of similar rectangles on the 11 by 11 geoboard, and find geoboard slopes between 1 and 2.
In a geometry class, the lesson can be used to review or preview similarity — and/or review slope. In an algebra class, it provides a concrete geometric foundation for slope.
Pedagogical insights:
- Algebra-geometry connections reinforce understanding in both domains.
- Searching for examples within mathematical constraints is an engaging group-worthy activity which provides repeated opportunities to discuss and clarify the constraints.
- Discrete explorations on a lattice provide a foundation for later work in the Cartesian plane.
Link: Similar Rectangles (scroll down)
Algebra: Themes, Tools, Concepts

Algebra: Themes, Tools, Concepts is the textbook I co-authored with Anita Wah in the 1990’s. Our commitment to “no one way” went along with a belief in a spiraling curriculum, as illustrated by photos at the start of each chapter. The importance of slope is reflected in the fact that we included that topic, more or less explicitly, in at least two dozen lessons. Those involve function diagrams (see below), input-output tables, Cartesian graphs, and “real world” examples.
Links to examples of the latter type::
- A preview involving Celsius-Fahrenheit conversion: A Hot Day
- Density of a mystery substance: In the Lab
- Graphing circumference vs. diameter for jars in Jarring Discoveries (scroll down)
- A growing child’s age, height, and weight.
- Stair safety: Stairs and Squares
- Modeling Motion
Pedagogical insight:
- “Real world” examples are relatable, and offer a context to reinforce the use of numerical and graphical representations.
Link: Algebra: Themes, Tools, Concepts
Function Diagrams
Function diagrams are a parallel axes representation of functions. For example, here is a diagram for y = 2x – 3:
In this representation, you can think of rate of change as magnification. In the above example, when x increases by (say) 3 units, y increases by 6 units: the magnification is 2. I try to use the word slope when discussing a Cartesian graph, rate of change when discussing a table of values, and magnification when discussing a function diagram. I have a fond memory of a student exclaiming: “Those are all the same thing!”, something I do not initially stress, or even mention.
An advanced use of function diagrams is making an intuitive case for the chain rule in calculus.
Pedagogical insights:
- An unfamiliar representation can provide a fresh context to talk about familiar concepts, thus helping the development of deeper understanding, evening the playing field among students, and triggering interest among those who would resent the repetition of same-old approaches.
- Some representations can be used over a wide range of grade levels.
Link: Function Diagrams
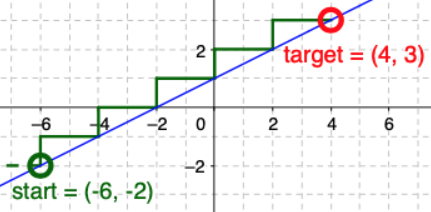
Slope Triangles
The visual representation of “rise over run” is a slope triangle. Adjacent slope triangles make a sort of visual staircase. I took advantage of that by creating a puzzle-like GeoGebra-based applet called Stairs. Here is an image that should give you a sense of how it works:
Lines can be graphed in there as well, which allows for additional possibilities, such as point-point or point-slope graphing puzzles.
I do not force specific lessons using the applet. It can be used with the exercises and challenges in the accompanying worksheets, or with problems posed by students or teachers.
Pedagogical insights:
- A hands-on puzzle can trigger curiosity, engagement, and a foundation for discussion.
- A visual representation of “rise” and “run” helps anchor the “rise over run” mantra in an intuitive way..
- Mistakes are instructive, and pave the way for correct solutions.
Link: Stairs
Make These Designs
A standard but ineffective use of electronic graphers is “graph this, graph that, what do you notice?” The problem with that approach is that the teacher (or the worksheet) is doing all the heavy lifting by suggesting what to graph. If instead students are given designs to make using y = mx + b, the tables are turned: it is the students who have to make the important decisions: choosing the m and b that will achieve the desired result. Here is a typical target design from the graphing-calculator era:
The activity can be done in any electronic grapher. It is forgiving: as in the Stairs applet, even unintended results can yield some learning. One way to reinforce understanding is to ask students to write explanations of how they created each design.
Pedagogical insights:
- A hands-on puzzle can trigger curiosity, engagement, and a foundation for discussion.
- “Mistakes” are instructive, and pave the way for correct solutions.
- “Low threshold, no ceiling” activities work with a wide range of students.
- Writing helps to reinforce understanding.
Link: Make These Designs
Doctor Dimension
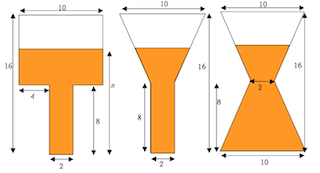
This is a geometric context to discuss rate of change in piecewise functions. The activities range from eighth to twelfth grade. The basic idea is to see how the rate of change changes as the “liquid” fills the “containers” as displayed above. This includes linear and nonlinear cases, and the inspection of the corresponding graphs. In precalculus, it allows for a discussion of “concave up” vs. “concave down”. In calculus, continuity and differentiability get into the picture. The unit culminates with a reversal: students design containers to match given graphs.
Pedagogical insights:
- A hands-on puzzle can trigger curiosity, engagement, and a foundation for discussion.
- Algebra-geometry connections reinforce understanding in both domains.
- A rich context can yield insights into multiple concepts.
Link: Doctor Dimension
Slope Angles
Different slopes yield different angles between the line and the x-axis. Acknowledging this bit of geometry in the Cartesian plane yields an unusual but very effective introduction to trig ratios. We can use students’ reasonably solid understanding of slope as a different way to introduce the tangent ratio: “rise over run” is a particular case of “opposite over adjacent”. So the standard trig exercise suggested by this image can be solved without mentioning trig at all:

This involves the use of the ten-centimeter circle, which allows students to find the slope corresponding to 39° using a ruler. Once the slope is known, calculating the length of the flagpole is straightforward: the run is given, and the number we seek is the rise. Once this is understood, the tangent ratio can be introduced, along with the corresponding calculator key or other electronic method to find the tangent or arctan.
This approach is based on student understanding, unlike the usual “sohcahtoa” mantra which relies on memorization. After that, I have found it useful to delay the introduction of the sine and cosine. This creates a later opportunity to review the tangent ratio, and to finally introduce “sohcahtoa” or “soppy cadjy toad”.
Pedagogical insights:
- Algebra-geometry connections can provide a powerful way into trigonometry.
- Vocabulary and notation are best introduced when there is some underlying understanding.
- Traditional sequencing of topics is not necessarily the best option.
Links: Slope Angles and Geometry Labs
Pattern Block Trains
This activity originated as a fifth grade introduction to rate of change, but I saved it for last because I extended it to end with an extremely challenging question, pretty much aimed at teachers.

Pedagogical insights:
- A hands-on activity can trigger curiosity, engagement, and a foundation for discussion.
- Algebra-geometry connections can yield activities at many grade levels
- Activities intended for students can yield interesting mathematical questions for teachers.
Link: Pattern Block Trains
Formal Proof
A curious fact about high school math is that students (and teachers!) never see a proof that the graph of y = mx + b is indeed a straight line, and conversely that a non-vertical line satisfies an equation of the form y = mx + b. I offer a worksheet that guides teachers through such a proof. Time constraints have prevented me from trying this with students, but the prerequisites are basic geometry theorems and some mathematical maturity.

Link: The Geometry of y = mx + b
Conclusion
Teaching the same thing the same way will yield the same result. Understanding an idea in multiple ways is an indicator of expertise. A quick scan of the above shows images that look completely different from each other. This is a further pedagogical insight: an approach depending on multiple representations and multiple contexts has substantial benefits.
- For some students, it offers repeated entryways into the concept. This is crucial if the initial lessons do not break through or sink in.
- For students who grasp the concept early, it avoids boredom and presents varied applications of the concept. This is far preferable to “review” that consists of a rehash of the same lesson.
- It keeps the concept alive over an extended period of time (in this case, all secondary school grade levels.)
Students appreciate variety. Math class should not always be the same day after day! One way to mix it up, as you see with the examples above is to use different learning tools: dot paper, geoboard, input-output tables, electronic graphers, online applets, function diagrams, the ten-centimeter circle, pattern blocks…
Well, I rest my case. I hope that I made my point, or at least that you found some activities to diversify and enrich your teaching!
— Henri
